Years ago I read an article about how to generate a neat animation of a quasicrystal. A quasicrystal is an ordered structure that is not periodic. Because it’s ordered it can fill an infinite sized space, but since it’s not periodic it doesn’t have symmetry. The classic example of this is Penrose tiles, you can use them to fill any sized space by matching the colors of the tiles, but it doesn’t create a symmetrical repeating pattern. The animation mentioned in that article is composed of overlapping sine waves rotated at different angles.
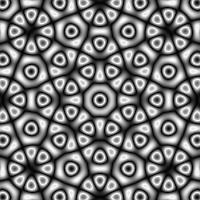
I thought this was extremely cool and had a lot of potential to make interesting psychedelic animations. Of course greyscale is boring, and I wanted to play around with the parameters, so I’d have to modify the original code. For example this image is generated with 7 overlapping waves rotated evenly from 0 to 360:
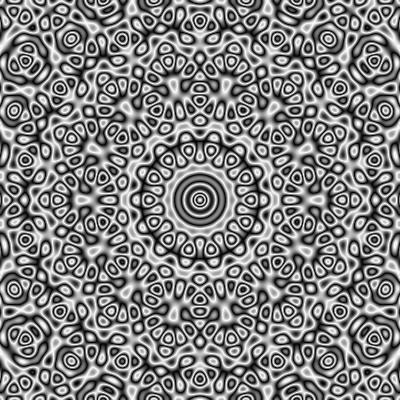
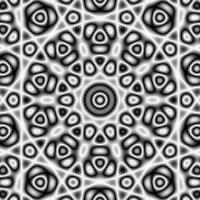
But what happens if angle one is 0, angle 2 is 180, and the rest are evenly split between 180-360? And what happens if we have 27 overlapping images?
In an effort to answer these questions, I ported the original Haskell code to Clojure. I chose Clojure because it’s easy to play with parts of a program using the REPL, and I knew Clojure better than Haskell. This taught me how the math works, but it was also very slow. So instead of answering my questions with the Clojure version, I ported it to Rust so I could play around with it easier since I wouldn’t have to wait so long for animations to generate.
I’m going to split this into 2 articles to keep them focused. In this article I’ll use the simpler Clojure implementation to explain how these images are composed6; this should give you a good understanding of how this program works on an abstract level. Don’t worry if you don’t know Clojure, you should still be able to understand the basics from looking at the images and my explanations. Then, in the next article I’ll go over the more complex multi-threaded Rust implementation, and show off some cool animations.
How it works
The original post does a good job of explaining the math, but I’ll go over it again here. Each frame of these animations is composed of several waveforms projected into 2d space, rotated, and combined. Each wave form looks like a bunch of stripes - here the values from 0 to 1 are rendered as a gradient from black (0), to white (1):
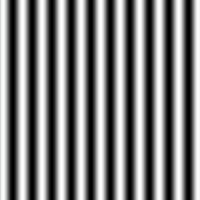
To animate it, we simply move the wave forward. The number that defines how far forward wave is moved is called the phase:

And this is the Clojure code to generate one frame of animation:
(defn wave
  "Returns waveform, the cos of all the y-values rotated by theta and moved
forward by phase"
  [theta x y phase]
  (let [cth (Math/cos theta)
        sth (Math/sin theta)]
    (/ (+ (Math/cos (+ (* cth x) (* sth y) phase)) 1) 2)))
A more formal way to write the equation in this function would be:
$$ \frac{\cos(x\cos(\theta) + y\sin(\theta) + phase) + 1}{2} $$Where \(\theta\) is the angle of the wave (e.g. 0 means the stripes are vertical), and \(phase\) is a number from 0-1. Note that this only generates numbers between 0 and 1, translating those into pixels of an image is a later step.
Next we have a simple function to generate a list of numbers evenly spaced between 0 and \(\pi\). These are the angles of the different layers:
(defn angles
  "Returns a list of n angles between 0 and PI"
  [n]
  (for [m (range n)] (* m (/ Math/PI n))))
This is done by taking each number from 0 to \(n\) and multiplying them by \(\pi\)/\(n\). These numbers will be fed into the theta argument of the wave function.
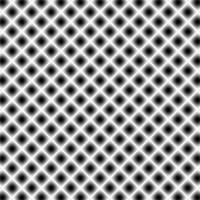
Next we have to combine the images. To do this we add the numbers of each pixel together, then wrap it between 0 and 1. This means is as the summed value goes from 0 to 1 the wrapped output goes from 0 to 1, then as the sum goes from 1 to 2 the wrapped output goes from 1 to 0, then 2-3 outputs 0 to 1, etc. For example adding two perpendicular waves gives us this:
This is the Clojure code to add and wrap values
(defn combine
  "Combines a list of values, and wraps the result between 1 and 0"
  [wavs]
  (let [ws (reduce + wavs)]
    (if (odd? (int ws))
      (- 1 (mod ws 1))
      (mod ws 1))))
To make the wrapped output we simply sum the inputs, then use the modulus operator to isolate the decimal part. Then if the non-decimal part is odd we’re going from 1 to 0, so we subtract the decimal part from 1. If the non-decimal is even we can just return the decimal part.
Finally we can combine these into a function that generates the values for one frame of animation:
(defn crystal
  "Returns a vector in the form [x y shade] where shade is the color at x and y"
  [max-x max-y phase num-angles]
  (for [x (range max-x) y (range max-y)]
    [x y
     (combine
      (map (fn [th] (wave th x y phase))
           (angles num-angles)))]))
This function takes the x and y dimensions, phase (aka frame of animation), and how many overlapping waves to use. It’s pretty straightforward; we just use the angles function to make a list of angles, then map the wave function over that list, then use the combine function to sum and wrap each value. This is repeated for each pixel of the image, and voila, we have the color values for a single frame.
Here’s what it looks like when we add 3, 4, and 5 layers:
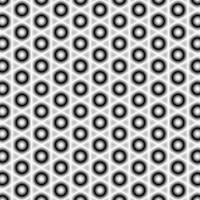
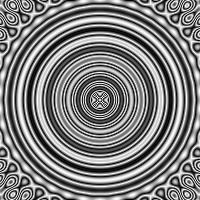
I’m not sure when these start being quasicrystals, but my goal is to make neat animations so I don’t really care. The original article used 7 layers, and 3 definitely isn’t a quasicrystal. 4 seems like it is, so maybe it’s every number after 3, but it might not be zoomed out enough to see the full pattern. As you add more layers you have to zoom out to see an interesting pattern, here’s 19 layers with the same zoom as the previous images:
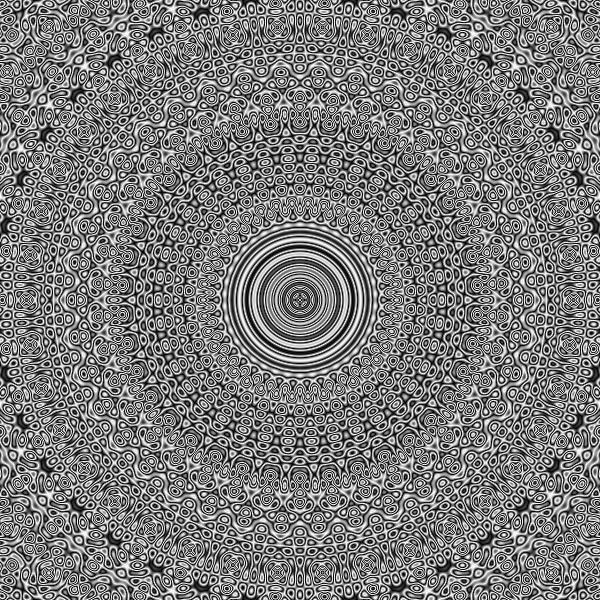
And a zoomed out and enlarged version:
I won’t go into detail for writing those values to an image or generating a list of frames as there are a lot of ways to do it and the way I picked is pretty slow. The summary is: I used Java’s BufferedImage class and a function to translate the 0-1 values into RGB values to output each frame as a jpg, then combined those with imagemagick into an animation. Combining them into a gif using Clojure was tricky and by that time I had already decided to make a Rust version.
Adding Color
The function to translate a 0-1 value into a RGB pixel (i.e. 3 values from 0-255) is worth talking about. This is where you can get creative, there are a lot of ways to translate a value between 0 and 1 to a color. Astronomers have explored this problem, as many telescopes only give a grayscale image, and adding color helps understand what they’re seeing. The simplest is obviously using 0 as one color (e.g. black) and 1 as another (e.g. white) for a basic gradient. One way I came up with is to map each r, g, and b value to a sawtooth wave that goes from 0 to 255, starting with some offset. For example an offset of 0.5 would start at 128 then go through 255, back to 0, then up to 128 again over the course of the animation. I believe this is just a way of implementing an animated version of the false color composite from that astronomy page, but I could be wrong - I just made it up to get something colorful. This is 6 overlapping layers with a red offset of 0, green of 0.25, and blue of 0.5:
This is very cool, but also very slow to generate, taking around 10 minutes on my old Macbook. In the next article I’ll go over the multithreaded Rust implementation of this program which is much faster. I also added a couple more parameters to tweak (such as zoom level), so I’ll show a gallery of animations generated with different settings. The code is on Github, the Clojure version is in a branch.